

A compelling chart shared on X (formerly Twitter) by Dr. Matthew M. Wielicki (@MatthewWielicki) cuts through the rhetoric on renewable energy. It ranks U.S. states by electricity affordability and overlays whether they enforce Renewable Portfolio Standards (RPS) and participate in cap-and-trade programs like the Regional Greenhouse Gas Initiative (RGGI).
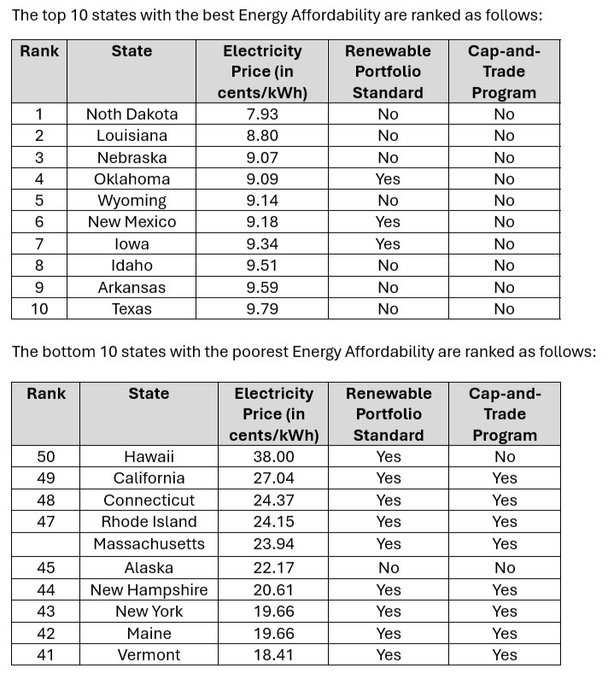
The top 10 most affordable states (as of the data in the post) include: North Dakota: 7.93 ¢/kWh (No RPS, No cap-and-trade)
Louisiana: 8.80 ¢/kWh (No RPS, No cap-and-trade)
Nebraska: 9.07 ¢/kWh (No RPS, No cap-and-trade)
Oklahoma: 9.09 ¢/kWh (RPS Yes, No cap-and-trade)
Wyoming: 9.14 ¢/kWh (No RPS, No cap-and-trade)
New Mexico: 9.18 ¢/kWh (RPS Yes, No cap-and-trade)
Iowa: 9.34 ¢/kWh (RPS Yes, No cap-and-trade)
Idaho: 9.51 ¢/kWh (No RPS, No cap-and-trade)
Arkansas: 9.59 ¢/kWh (No RPS, No cap-and-trade)
Texas: 9.79 ¢/kWh (No RPS, No cap-and-trade)
In contrast, the bottom 10 most expensive states feature heavy mandates: Hawaii: 38.00 ¢/kWh (RPS Yes, No cap-and-trade)
California: 27.04 ¢/kWh (RPS Yes, Cap-and-trade Yes)
Connecticut: 24.37 ¢/kWh (RPS Yes, Cap-and-trade Yes)
Rhode Island: 24.15 ¢/kWh (RPS Yes, Cap-and-trade Yes)
Massachusetts: 23.94 ¢/kWh (RPS Yes, Cap-and-trade Yes)
… and similarly high-cost states like New York, Maine, and Vermont, nearly all with both RPS mandates and cap-and-trade.
Recent EIA data (January–April 2026) confirms the pattern holds: national residential averages hover around 17–18 ¢/kWh, but low-cost states like Louisiana (12.4 ¢/kWh), North Dakota, Idaho, and Texas remain in the low teens, while California (30–33 ¢/kWh), Connecticut, Massachusetts, and other Northeast states exceed 20–30+ ¢/kWh.
Energy Mixes Reveal the Real Drivers
Examining state-by-state generation mixes from EIA data shows that renewables alone do not drive high costs—it’s the policy framework around them. Low-cost states with significant renewables (often 30–60%+ from wind/solar in places like Iowa, North Dakota, South Dakota, Kansas, Oklahoma, New Mexico, and Texas) benefit from: Abundant, low-cost resources: Wind in the Great Plains is among the cheapest electricity sources when sited optimally. North Dakota generates 35–37% from wind but pairs it with ~50%+ coal for a reliable baseload. Texas leads nationally in wind (22–28% of generation) and solar growth, yet relies on ~45–50% natural gas and a competitive, deregulated market.
Market-driven integration: Renewables expand where economics make sense (no forced overbuild). Texas has no statewide RPS mandate and has kept prices competitive.
Minimal added system costs: Little need for massive storage or long-distance transmission mandates.
High-cost states pushing Net Zero (California, New York, Massachusetts, Connecticut, Vermont, Maine, etc.) show a different picture: Aggressive RPS/Clean Energy Standards (often 50–100% by 2030–2045) + Net Zero GHG goals by 2045–2050 force rapid deployment of wind, solar, and storage regardless of local resources. California’s mix is ~38% solar/wind + hydro, with heavy gas backup, but prices remain high due to policy layering.
Cap-and-trade (RGGI in the Northeast, California’s program) adds direct compliance costs passed to ratepayers. Studies show RGGI participation has increased wholesale prices in participating PJM zones by several dollars per MWh, with system-wide consumer costs rising ~$1.8 billion annually in some analyses.
Storage and intermittency mandates:
Net Zero policies require massive battery storage (expensive and still limited-duration) plus overbuild and transmission upgrades. California’s rooftop solar boom and storage rules have shifted fixed grid costs onto non-solar customers, inflating rates.
Regulatory overreach:
Lengthy permitting, environmental reviews, union labor requirements, and “just transition” mandates delay projects and raise capital costs. Northeast offshore wind (forced despite high costs) exemplifies this.
States with 100% clean energy or Net Zero targets (24+ states + D.C., concentrated in the high-price West Coast and Northeast) consistently show elevated bills. Market-oriented states with high voluntary wind (e.g., Texas, Iowa) do not.
The evidence is clear: Wind and solar can be low-cost when added where resources are best and markets are free. But layering Net Zero mandates, forced storage, cap-and-trade, and regulatory barriers creates the “system costs” Dr. Wielicki highlights—backup, overbuild, transmission, and policy overhead—that show up on your bill. Energy policy should prioritize affordability and reliability, not ideological targets. As more states chase Net Zero, expect the pattern in Wielicki’s chart to worsen unless course-corrected.
Appendix: Sources and Links
- Original X post by
@MatthewWielicki
(April 4, 2026): https://x.com/MatthewWielicki/status/2040434415327936747
- EIA Electric Power Monthly (latest prices and generation data, 2025–2026): https://www.eia.gov/electricity/monthly/ and https://www.eia.gov/electricity/data/state/
- EIA State Electricity Profiles (2024 data, released 2025): https://www.eia.gov/electricity/state/
- Choose Energy / EIA January 2026 generation mix by state: https://www.chooseenergy.com/data-center/electricity-sources-by-state/
- Net Zero / 100% Clean Energy State Goals (CESA): https://www.cesa.org/projects/100-clean-energy-collaborative/guide/table-of-100-clean-energy-states/
- NCSL Renewable Portfolio Standards Summary: https://www.ncsl.org/energy/state-renewable-portfolio-standards-and-goals
- RGGI Impact Analysis (Tabors Caramanis Rudkevich white paper, 2025): https://tcr-us.com/uploads/3/5/9/1/35917440/tcr_white_paper_rggi_2025_03_06.pdf
- Additional context: Electricity Rates by State (ElectricChoice, April 2026): https://www.electricchoice.com/electricity-prices-by-state/
Energy News Beat – Delivering unfiltered energy news and analysis.